


| Tableau is a powerful and fastest growing data visualization tool used in the Business Intelligence Industry. It helps in simplifying raw data into the very easily understandable format. Data analysis is very fast with Tableau and the visualizations created are in the form of dashboards and worksheets. |
-----------------------------------
|
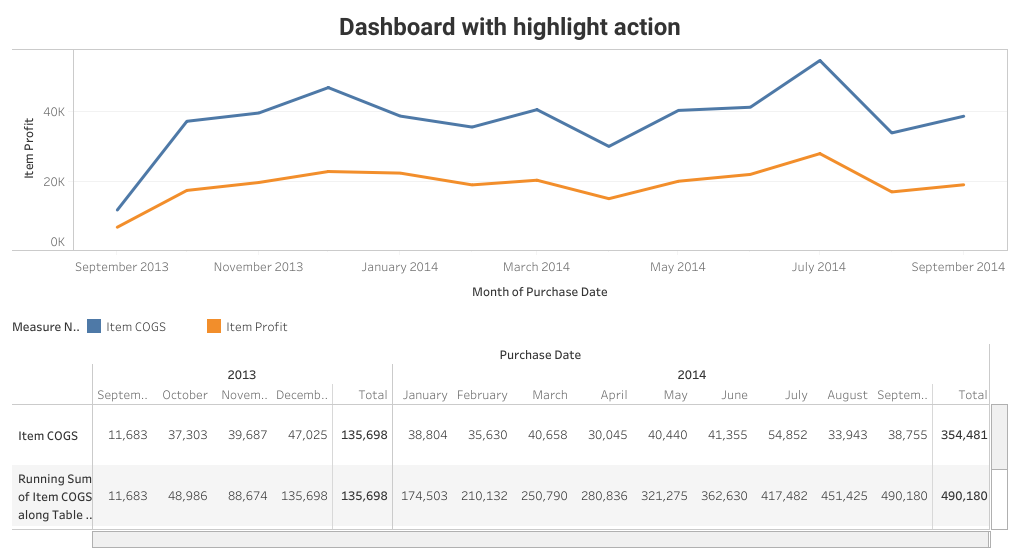
I learnt Tableau using some online tutorials and some courses on Udemy. I found this tool very interesting because of it's capability to connect to different data sources
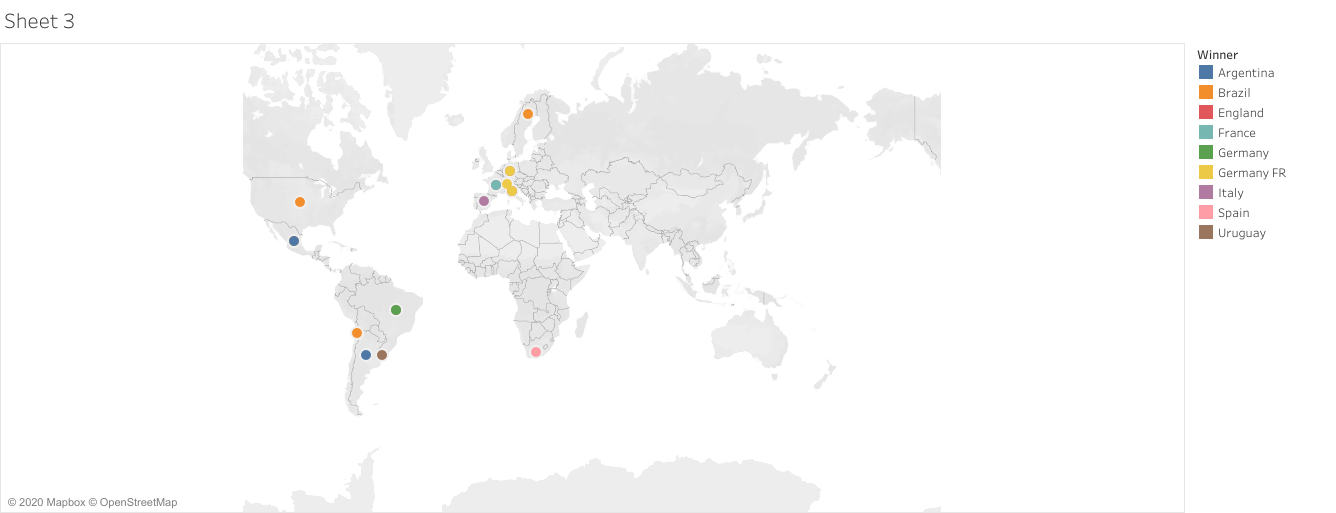
and the freedom to visualize table data into numerous forms. There are different components in Tableau, some of them are 1. Tableau Desktop - As the name suggests it's a desktop application 2. Tableau Online - To publish your dashboard to your online account 3. Tableau Public - From here you can use your Dashboard/Graphs to embed them into your HTML pages and a lot more |
My Tableau Public account